DEI metrics that measure and drive meaningful change


In 2025, 93 women were promoted to managerial roles for every 100 men.* The gap was even wider for women of color, with only 74 promoted for every 100 men. It’s not a difference in qualifications, either: Unconscious biases mean unfair business practices can sneak in even when you’re trying to create a workplace where everyone thrives.
To avoid falling prey to this common dilemma, HR teams can start monitoring diversity, equity, and inclusion (DEI) metrics in their workforce. Figures like pay equity and promotion rate across demographic segments give organizations a reliable way to measure how fairly — or not so fairly — opportunity is spread across the workforce, then adjust as needed.
But simply gathering and reporting as many data points as possible is a sure path to noise, not signals. You need a strategy that distills demographic and other employee data into specific insights about experiences and outcomes. Smart HR teams then leverage these insights to identify and break down barriers and make better decisions for a more equitable workplace.
By the end of this guide, you’ll understand how to choose the DEI metrics that make a difference for your strategy, and how to back decisions with that data to create meaningful, lasting change.
* McKinsey & Company, 2025
What are DEI metrics?
“There have been reports for thirty years showing that diverse organizations are more profitable. It’s not a reporting issue — it’s a caring issue.”
— William Tincup, Co-Founder of WorkDivined
DEI metrics are quantitative and qualitative data points HR teams use to measure progress toward a fairer workplace across employee demographics, like gender and race.
The three components of DEI are intimately connected, but not the same. Equity metrics focus on whether your workforce has equal access to opportunities. Metrics for diversity and inclusion, on the other hand, look at who makes up your workforce and how much employees feel part of the team.
Organizations use these metrics to back DEI initiatives with their employees’ thoughts and actions instead of best guesses about what would make people feel included. Savvy HR teams move past bare-bones compliance reporting to craft recruitment, development, and promotion decisions from meaningful context.
How do companies measure DEI?: Common DEI examples
“Stop treating listening like a one-off. Create a reliable cadence that blends sentiment and demographics, so leaders get clarity on where to focus and managers can act with confidence.”
— Craig Forman, Founder and Principal Consultant at CultureC Consulting
There are different angles HR teams can use to capture diversity, equity, and inclusion. Here’s a look at some of the most useful metrics for each one.
Diversity metrics
“Culturally competent managers recognize and appreciate the differences in the people that report to them and subsequently take an individualized, but collective approach to weaving together a beautiful quilt of diversity and a sense of belonging on their teams.”
— Geri-Ann Galanti, Medical anthropologist, via Gallup
A diverse workforce isn’t just a good look. It’s a competitive advantage. A 2023 McKinsey report noted that companies in the top quartile for ethnic diversity enjoy an average financial advantage of 27%, and businesses with executive teams made up of at least 30% women are significantly more likely to financially outperform those with fewer women.
Here are the most useful diversity metrics to see where your organization stands:
- Workforce demographics are the baseline all other DEI metrics draw from. They describe the overall makeup of your employees across areas like gender, age, and ethnicity.
- Leadership representation snapshots the demographic makeup of the people running the organization, from managers to the C-suite.
- Hiring diversity measures the demographic makeup of candidates at each level of your recruitment pipeline. Recruitment strategy is your primary lever for increasing workforce diversity, so your hiring diversity points to where the organization is headed.
Equity metrics
“Pay gaps show the average difference between groups, but that doesn’t tell the full story. Pay equity means comparing like with like: same role, same experience, same performance.”
— Alexandra Edl, Senior HR Consultant at EDL Consulting
Equity metrics can show you where there are gaps in access to opportunities, revealed in measurements segmented by demographic, like the following:
- Pay equity shows whether employees with similar job descriptions, experience, and performance outcomes also get similar paychecks, regardless of demographic factors.
- Promotion rates between employee groups signal whether promotions recognize performance or power your leadership pipeline with unconscious in-group preferences.
- Performance review equity indicates how impartial performance conversations are. If specific demographic groups consistently receive lower scores (like older employees who are consistently rated lower on technological skills despite no skill gap in the work), bias may have crept in.
Inclusion metrics
Examining inclusion metrics like these helps HR teams gauge whether some employees or demographic groups feel left out:
- Employee engagement numbers show how motivated and invested employees feel overall. If there’s a dip among specific groups, look deeper — affected employees might be demotivated due to feeling excluded.
- Retention rates show who’s leaving the organization and when. If it’s more common in underrepresented demographics, it’s worth digging deeper to see if other employees in that group feel they’re getting the same level of support as everyone else.
- Inclusion survey scores reveal whether employees feel safe and respected at work. That directness makes them one of the most effective ways to temperature-check whether you’ve built an inclusive workplace.
How to use DEI metrics to make smarter workforce planning decisions
The most valuable DEI metrics are ones that have a tangible impact on leadership’s next move. As a 2023 Deloitte Insights report put it, “DEI actions should be in service of achieving equitable outcomes in the workforce — and broader society — while boosting an organization’s innovation, competitiveness, and long-term business success.”
Organizations that get DEI analytics right often include these metrics in their monitoring:
- Learning participation: Looking into who’s being encouraged to grow their skill sets and who isn’t can help you catch accessibility gaps before they lead to disengagement and turnover. For example, according to McKinsey’s Women in the Workplace 2025 report, only 21% of women working at an entry level are encouraged by their managers to use AI tools compared to 33% of men in entry-level roles. At the same time, employees encouraged to use AI tools are more than 50% more likely to build the skill, which gives them a competitive advantage.
- Sponsorship and mentorship: That same 2025 McKinsey report noted that employees with sponsors who are willing to go to bat for them get promoted almost twice as often as those without them. Yet only 31% of entry-level women have sponsors, compared to 45% of men. Not only is this unfair for individual growth, but it also means organizations are systematically underinvesting in their people.
- Feedback frequency: Consider how often employees receive meaningful, constructive feedback from their higher-ups. When feedback sessions are few and far between, it’s easy for employees to lose motivation because they lack a sense of how they’re doing.
“When leaders see and call out individual contributions, it builds purpose and belonging — especially when everyone’s behind a screen.”
— Luck Dookchitra, former VP of People and Culture at Leapsom
When it comes to building a functional system for equitable growth, knowing your organization’s DEI metrics is half the battle, but you can’t stop halfway. HR teams also need deep visibility into employee development and performance outcomes to understand what needs repairing. Leapsome’s HRIS and people management platform puts all that information in one place for deeper insights over time and across segments.
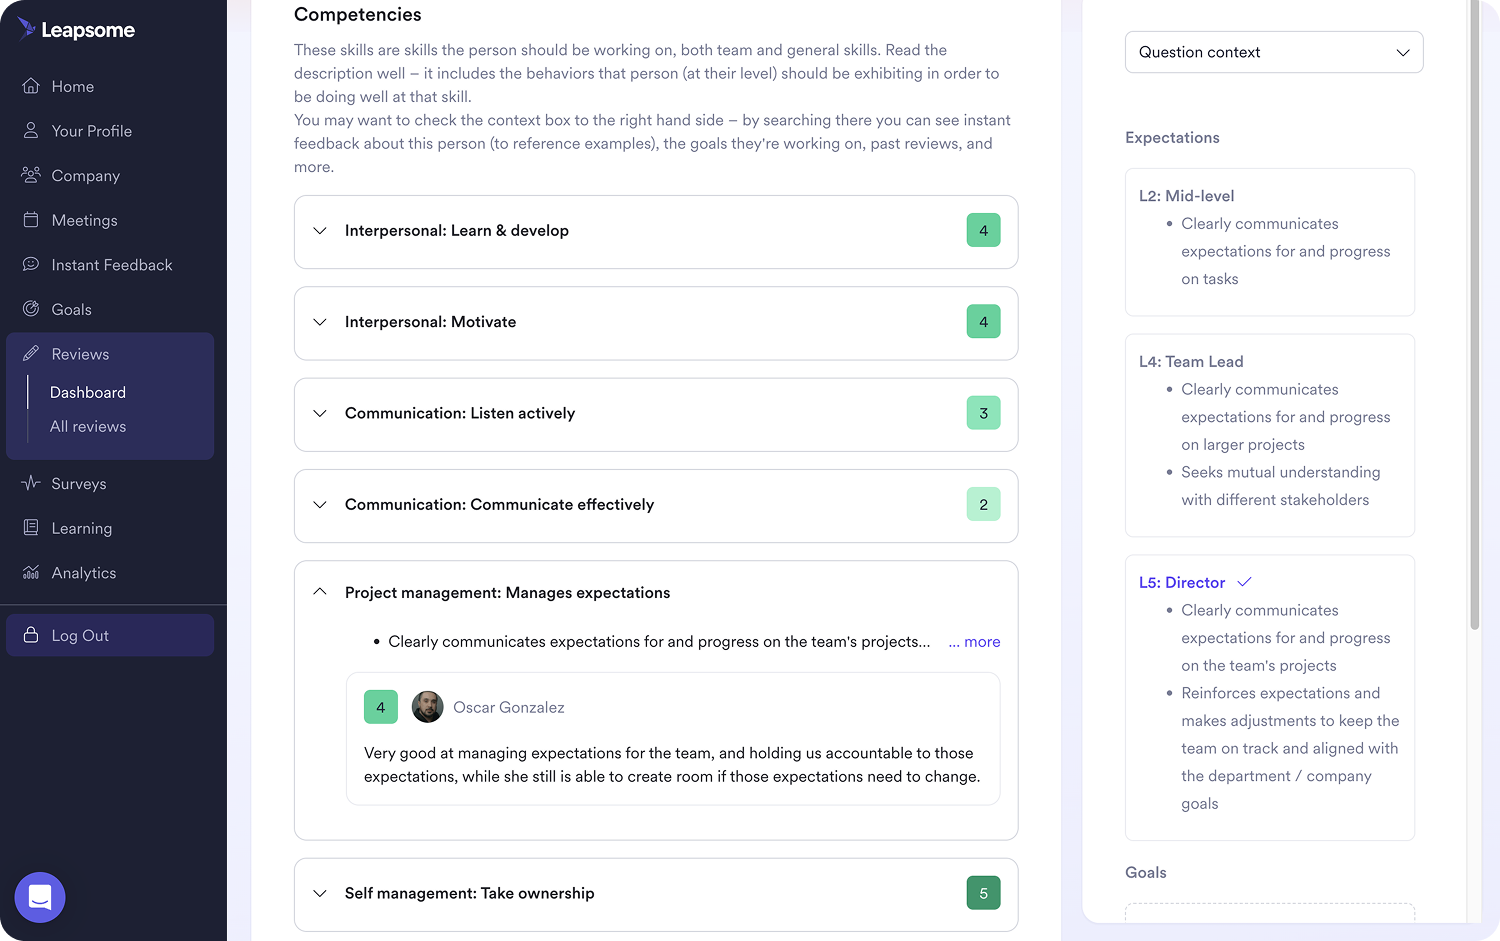
🔍 Find and fill uneven performance gaps
Leapsome reveals patterns in feedback, development, and career progression to gauge whether growth opportunities are distributed fairly across the workforce.
👉 Explore Performance Reviews
Representation metrics are an indispensable jumping-off point for organizations, but they only highlight demographic makeup, not whether employees truly have equal growth opportunities. In other words, you can’t use representation data alone to create a workforce that works for everyone. After all, two organizations with identical demographics may look very different when it comes to day-to-day employee experiences.
Here are some of the most common mistakes HR leaders make with their DEI metrics that keep them from achieving that broad success:
- Measuring dozens of metrics without a clear goal: There’s a good chance you won’t end up uncovering much more than inert figures that are tough to actually act on.
- Compiling metrics without attaching action plans: Each metric you monitor should answer a specific question you want to do something about, so it’s clear why you’re collecting that data.
- Putting compliance before employee outcomes: DEI analytics can look performative if nothing comes of it. These compliance efforts become a formal exercise HR team members ignore instead of an avenue for real growth opportunities.
Employee feedback often reveals inclusion and belonging challenges long before they show up in a spike in turnover or a dip in workforce performance — as long as you have reliable tools. Leapsome’s HRIS and talent management platform collects this information and connects it to data like employee demographics, so you can segment your metrics however you need to get the strongest insights.
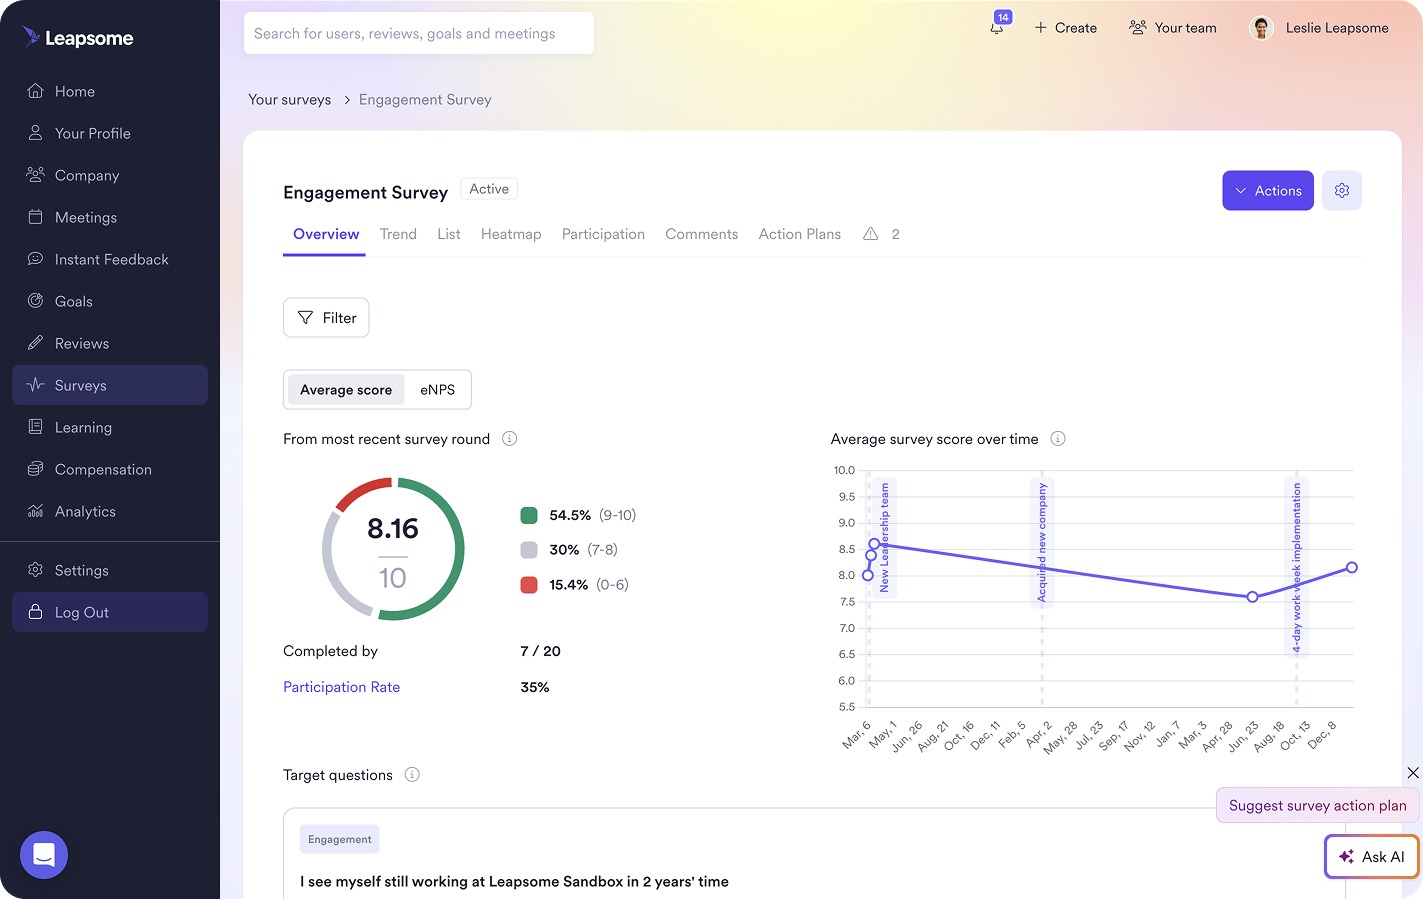
📶 Spot disengagement signals before they become patterns
Compile meaningful employee feedback and catch trends across workforce demographics to tease out opportunities and boost engagement and inclusion at the same time.
👉 Explore Engagement Surveys
Measure DEI to build a fair, diverse workplace with Leapsome
Fragmented data plugged into disconnected systems makes it almost impossible to see the employee experience clearly. And judging by the latest DEI statistics, this isn’t a rare phenomenon.
Measuring DEI effectively means creating a self-reinforcing feedback loop by connecting workforce data to employee feedback and development opportunities. Leapsome helps you create those connections through:
- Engagement Surveys: Run expert-designed or custom surveys across demographic segments to track engagement trends and spot where groups are getting left behind.
- Performance Reviews: Conduct structured, 360° performance reviews that minimize individual bias and maximize insights.
- Competencies: Develop standardized skills frameworks connected directly to role requirements, so promotion decisions are based on the exact same criteria for everyone.
- Goals and OKRs: Track goals at the individual, team, and organizational levels, including clear ownership and structured timelines, so everyone knows what success looks like.
- Employee Records: Keep all the important employee data in the same location to generate interconnected insights that put your DEI initiatives on the right track.
“We build trust from day one with live 30, 60, and 90-day check-ins where employees speak openly with HR — and even with the CEO at the one-year mark. When people see action after those talks, they start to trust that feedback truly leads to change.”
— Janelle Daugherty, Head of People and Culture at Notion Health
🔗 Convert feedback into fairness
See how Leapsome helps you take charge of your organization’s DEI story by linking engagement and workforce data to the processes that shape careers.
👉 Request a demo

.png)