People analytics: the ultimate guide for 2026


Seven in ten HR leaders agree today’s business climate is tough. Many HR teams face budget cuts without a reduction in workload. In fact, 71% of leaders feel they need to strengthen their people-centric skills this year, and 74% report a need to build more technical expertise to navigate the current landscape.*
To operate effectively with fewer resources, HR teams must embrace data-driven decision-making. More specifically, they’ll need to lean into the power of people analytics — prioritizing evidence-based insights over instinct.
Are you just getting started with data? Or are you searching for ways to refine your people analytics strategy? Either way, our comprehensive people analytics guide has you covered.
🚀 Transform raw employee data into informed decisions
Leapsome equips HR leaders with the tools and insights to improve engagement, development, retention, and more.
👉 Explore Leapsome’s people analytics
*Leapsome Workforce Trends Report, 2024
What is people analytics?
People analytics is the practice of collecting and interpreting HR metrics to inform business decisions. It relies on data like employee engagement scores and performance ratings — but its impact extends far beyond HR.
The goal of people analytics is to uncover trends that reveal organizational strengths and weaknesses. With this information, you can improve the efficiency and effectiveness of your HR processes and, ultimately, boost business performance and employee satisfaction.
94% of business leaders say people analytics elevates the HR profession, and Deloitte reports that companies with people analytics strategies have better financial outcomes (with increased revenue per employee and/or cost savings through reduced turnover).
The most important people analytics trends in 2026
HR leaders can expect the following trends to impact and shape people analytics strategies this year:
- Focus on the employee experience — As job satisfaction lowers, HR teams are using people analytics to identify opportunities for improving well-being and engagement.
- Employee-centered KPIs — HR leaders are redefining key performance indicators (KPIs) to include less tangible factors like collaboration and innovation, aiming to nurture creativity and restore employee trust.

- AI and automation — Artificial intelligence and machine learning are becoming integral to people analytics, enabling predictive and prescriptive insights. For example, Leapsome Surveys’ AI-powered sentiment analysis feature turns employee feedback into clear insights for HR professionals — enabling them to take quick and decisive action.
💡 Janelle Doharty, Head of People & Culture at Knowtion Health, touched on the importance of people analytics during a recent Leapsome webinar.
She shared the somewhat tongue-in-cheek advice she provides team members when they’re struggling to connect the dots between HR processes and overarching business goals:
“[In 2026] I need us to only talk in dashboards. I need us to only talk about data. It’s not about how I feel. It’s not about how you feel or how frustrated you are when hiring managers aren’t listening or new hires aren’t completing their tasks. The emotion is gone. Let’s talk about what the data is telling us, and then, what our action item is.”
Janelle’s advice carries a very real and timely message: Data analysis will be essential to success in all departments this year — HR included.
6 ways to use people analytics within your organization
People analytics can be applied in various different ways to improve HR and overarching business processes. We’ve compiled a few of the most promising ways to put your People data to work below.
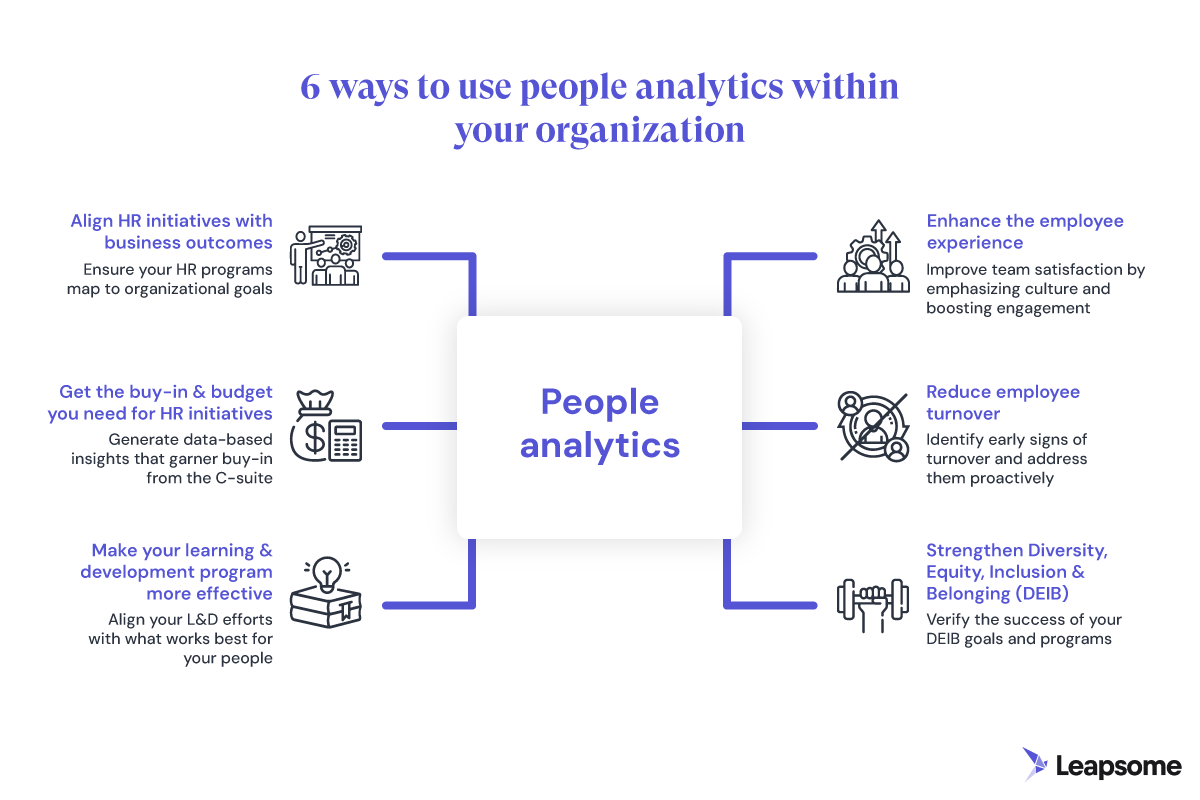
1. Align HR initiatives with business outcomes
People analytics enables HR leaders to map initiatives directly to business performance. No more estimating the impact of your performance management system or guessing headcount needs — people analytics can fill in the blanks.
💡 “HR leaders should adopt a holistic approach, aligning people programs with broader business goals while addressing employee needs.
Prioritizing initiatives that foster stability, career growth, and manageable workloads helps keep employees engaged and drives overall business success.”
— Luck Dookchitra, VP of People & Culture at Leapsome
Additionally, the ability to tie your people management initiatives to organizational outcomes helps transform HR leaders into strategic assets in the eyes of your C-suite.
2. Get buy-in & budget for HR initiatives
More than half of HR leaders faced budget cuts last year, according to Leapsome’s 2024 Workforce Trends Report. To secure funding, HR professionals need data that speaks the C-suite’s language — and People analytics provides the data points you need.
Instead of emphasizing anecdotal wins, people analytics allows you to show how initiatives — like wellness programs — contribute to a better employee experience and drive business performance.
Remember, your objective is to achieve buy-in and demonstrate HR ROI. Ultimately, you’ll improve outcomes for your people (and company) in the process — that’s always the most important goal.
3. Make your learning & development program more effective
.jpg)
Analyzing the success of your learning and development (L&D) programs ensures that your training efforts deliver tangible value while engaging your people. People analytics can reveal which courses are most popular, show which employee development methods have the highest completion rates (indicating whether employees respond better to self-paced courses or blended learning formats, for example), and pinpoint high-ROI skills that align with long-term business goals.
🏆 Take your L&D goals to the next level
Leapsome Learning helps professionals move forward in their careers and engages them all at once.
👉 Learn more
4. Enhance the employee experience
A strong employee experience drives retention, satisfaction, and innovation — and it’s linked to financial outcomes. Gallup reports that companies in the top quartile of employee engagement achieve 23% higher profits than those in the bottom quartile.
When you track employee experience metrics like eNPS score, engagement rates, and staff wellness levels, you can work proactively and keep people happier. Analyzing employee skills, interests, and career aspirations can also help you offer more targeted development opportunities.
5. Reduce employee turnover
Understanding why employees leave is key to improving retention. People analytics can help organizations track turnover trends across departments, roles, and demographics, making it easier to pinpoint problem areas. And by analyzing engagement data and employee sentiment trends, HR teams can identify early signs of dissatisfaction and take proactive steps to address concerns.
Advanced platforms like Leapsome even use forecasting technology to predict employee turnover down to individual teams and departments.
6. Strengthen Diversity, Equity, Inclusion & Belonging (DEIB)
Over the last several years, many organizations have announced specific DEIB metrics and best practices they’re working toward. For example, Mozilla pledged to double the percentage of Black and Latinx staff members in the United States. In the year following that announcement, the percentage of Black Mozillians increased from 4.8% to 7.8%.
Measurable DEIB goals are important to establish. And, people analytics programs are critical for accountability.
People analytics can help you track diversity across hiring, internal promotions, and attrition. This can help you identify (and mitigate) biases in hiring practices, pay equity, and career advancement.
Additionally, inclusivity metrics, like employee satisfaction by demographic and participation in DEIB programs, can provide valuable insights into how employees of different backgrounds experience your workplace.
Examples of how you can use people analytics to make more impactful decisions
We’ve outlined some of the best ways to integrate people analytics into your HR and organizational process. Let’s review people analytics case studies to discover how these strategies have benefitted real businesses.
Credit Suisse: improving internal mobility & retention
Credit Suisse used people analytics to study employees’ career trajectories. They examined promotions, raises, and life transitions to predict who was at risk of departing within the following year.
The biggest takeaway? Lackluster job mobility was hurting retention, and most job openings were being filled externally. So, the People team revamped its hiring process, encouraging recruiters to reach out to internal applicants directly before posting jobs externally. Following this change, retention improved, and 20% of new positions were filled by existing Credit Suisse employees.
In addition, Credit Suisse found that women were more likely to leave their jobs during significant life transitions, like following a promotion or parental leave. This realization prompted the bank to provide additional support to these team members during important professional and personal milestones.
Best Buy: communicating the ROI of the employee experience
The retail giant used people analytics to calculate the ROI of employee engagement at a store level. They found that a 0.1% increase in employee engagement at one location translated to US$100,000 in earnings.
With this finding, Best Buy advocated for more frequent engagement initiatives and now conducts quarterly employee surveys.
💡 Want to calculate the potential ROI of prioritizing employee enablement within your organization? Use Leapsome’s ROI calculator to get started.
Collect data, analyze, take action & repeat with Leapsome

As technical skills become essential in HR, people analytics will be critical for resource-strapped teams. But you don’t need to go it alone. Top people analytics software like Leapsome can help you maximize the efficacy of your existing employee data and HR metrics, turning disconnected information into a clear view of your HR programs and their place in business success.
Leapsome transforms your organization’s internal data into easy-to-use insights with visualizations and user-friendly dashboards. Our expert recommendations ensure you’re on the right path when you begin applying your findings so you can make proper adjustments.
🎉 Turn analytics into action
Don’t let valuable HR metrics go unused — Leapsome empowers you to unlock critical insights and take decisive action.
👉 Book a demo
Frequently asked questions about people analytics
Why is people analytics important?
People analytics empowers HR leaders to make informed decisions, reduce turnover, and align HR strategy with business outcomes by transforming raw HR data into actionable insights.
For example, are your decisions unintentionally leading to increased turnover? Could you do a better job of onboarding new hires? Does your hiring strategy align with your organizational growth goals? People analytics answers these questions by visualizing key trends, identifying challenges, and highlighting opportunities for improvement. This evidence-based approach ensures that HR leaders can move beyond intuition, making strategic decisions backed by concrete data.
How does people analytics work?
People analytics can “work” in various ways, depending on your tech stack, organizational needs, and individual goals. Generally speaking, you’ll need a People analytics tool to synthesize relevant employee data and conduct analyses. These platforms use algorithms, automation, and AI to generate easy-to-digest insights from your data, including visualizations and storytelling that summarize the effectiveness of your organization’s strategies.
People analytics software like Leapsome offers both a modular platform for specialized HR functions (like performance reviews, learning, and engagement) and HRIS capabilities. The platform’s AI-powered analytics integrate data across these modules to provide comprehensive insights. Other platforms don’t offer such integrated solutions, so you may need multiple tools with integration capabilities to accomplish your analytics goals.
What’s the difference between people analytics & HR analytics?
Some people use the terms people analytics and HR analytics interchangeably. However, they have slightly different focuses.
People analytics uses HR data to evaluate how things are going both within and outside the HR department. For instance, a CFO might compare annual recurring revenue (ARR) with trends in employee engagement to understand how people’s happiness impacts financial performance.
In comparison, HR analytics specifically support HR goals. An HR leader might use it to refine hiring processes and enhance employee satisfaction.
What are the 4 different types of people analytics?
You can break people analytics into four categories: descriptive, diagnostic, predictive, and descriptive. Each plays an important role in understanding the effectiveness of your current programs:
- Descriptive analytics — Shows how well your programs and initiatives are performing based on HR data
- Diagnostic analytics — Uncovers the reasons behind those results by analyzing historical patterns
- Predictive analytics — Forecasts potential outcomes using past data
- Prescriptive analytics — Recommends actions to achieve specific goals by outlining different possible scenarios
What are the biggest benefits of people analytics?
There are many possible benefits to a strong people analytics strategy, including:
- Better alignment between HR initiatives and business outcomes
- Increased buy-in from senior leadership
- Improved L&D outcomes
- Enhanced employee experience
- Reduced turnover
- More effective DEIB strategies
Leapsome Team

.jpg)


%20(1).jpg)
Ready to transform
your People operations?
Automate, connect, and simplify all HR processes across the employee lifecycle.
.webp)
.webp)
 Request a demo today