Employee experience metrics: a practical guide to measuring what matters


HR teams are under growing pressure to prove the impact of their work. As workplace expectations shift across generations, economic headwinds persist, and hybrid models become the norm, leadership is asking tougher questions: How do we know if our employee experience efforts are working? What should we even be measuring?
It’s a fair ask — but not an easy one to answer. In fact, 43% of HR leaders say their teams are feeling overwhelmed by new responsibilities, according to recent research.* And without clear, meaningful metrics, it’s even harder to prioritize what matters.
Employee experience (EX) isn’t one moment. It spans the entire lifecycle, from onboarding to exit, and touches everything from culture and communication to systems and leadership. Traditional metrics like eNPS or engagement scores offer some insight, but they don’t tell the whole story. Measuring what’s easy isn’t the same as measuring what matters.
This guide breaks down how to define, measure, and act on EX metrics across five key lenses:
Lifecycle stages, work modality (onsite vs. hybrid/remote), internal tool usability, links to business KPIs, and dashboard design for visibility and action.
Whether you’re starting from scratch or refining your approach, this guide will help you measure what truly moves the needle.
✅ Start measuring what matters
Track key EX metrics across the employee lifecycle, connect them to business outcomes, and turn insights into action — all in one platform.
👉 Explore People Analytics
*CIPD, 2024
Why employee experience metrics need a strategic measurement approach
Too often, employee experience (EX) measurement gets reduced to a single data point — typically engagement or eNPS. But while those signals matter, they barely scratch the surface of what employees actually experience day-to-day. Real experience isn’t confined to an annual pulse survey — it’s shaped by every interaction across the employee lifecycle, from onboarding and growth to feedback and exit.
That’s why a strategic approach to EX measurement is critical. It’s not about tracking more data; it’s about tracking the right signals at the right time, with a clear line of sight to business outcomes. For example, high participation in learning programs might not mean much if internal mobility stays flat — but together, they can highlight whether development efforts are actually driving growth.
HR teams need to prove impact. That means moving beyond broad sentiment to granular, contextual metrics — metrics that can guide decisions, spot risks early, and support smarter planning. A strategic EX framework ensures that each stage of the employee journey is measured intentionally and that those insights are actionable across HR, leadership, and operations.
How to map employee experience metrics to lifecycle stages
To measure employee experience meaningfully, you need to zoom in on each stage of the employee journey — because what matters during onboarding looks very different from what matters at exit. Below is a framework to help you select the right EX metrics by lifecycle milestone, with a focus on actionable signals that HR and managers can track, interpret, and act on.
Onboarding
A thoughtful onboarding experience accelerates productivity and connection. These metrics capture how well new hires integrate and ramp up:
- Time to productivity: How long it takes for new hires to contribute meaningfully in their role.
- New hire satisfaction (30/60/90 days): Captures early sentiment and onboarding quality.
- Early attrition rate: Percentage of new hires who leave within the first 3–6 months.
Development & growth
Employees want to grow, and your support matters. These metrics highlight how well your organization nurtures skills and career progression:
- Internal mobility rate: Tracks how often employees move into new roles or departments — a sign of growth opportunities and internal talent recognition.
- Manager feedback quality: Measures the usefulness, clarity, and timeliness of feedback shared during reviews or check-ins.
- Percentage of completed manager 1:1s: Indicates how consistently managers are showing up for their teams and supporting individual development.
- Learning participation & completion: Assesses employee engagement with training programs and their ability to follow through on development goals.
Retention & engagement
Keeping top talent shouldn't come down to perks. It’s about connection and purpose. These metrics reflect how well you're meeting employee needs over time:
- Employee engagement score: Broader sentiment across belonging, motivation, and purpose.
- Participation in feedback loops: Measures employee involvement in surveys, 1:1s, or reviews.
- eNPS (Employee Net Promoter Score): Gauges how likely employees are to recommend your company. For a deeper look into how it works, read our full eNPS guide.
%2520(1).jpeg)
Exit
Departures also shape your employer brand. These metrics help you understand why people leave—and how to improve the experience for those who stay:
- Employee exit interview sentiment: Qualitative and scored insights from outgoing employees.
- Regrettable attrition rate: Tracks the loss of high performers or critical roles.
- Boomerang rehire interest: Whether leavers would consider returning — a powerful signal of EX quality.
- Employee exit surveys: Enrich interview insights with anonymous, structured feedback.
This lifecycle lens gives you structure, but it’s only the first step. Up next: how to adapt these metrics based on how and where people work.
Measuring EX in hybrid vs. onsite work environments
To better understand how employee experience metrics vary by work environment, the infographic below highlights key differences in focus areas between onsite and hybrid/remote teams.
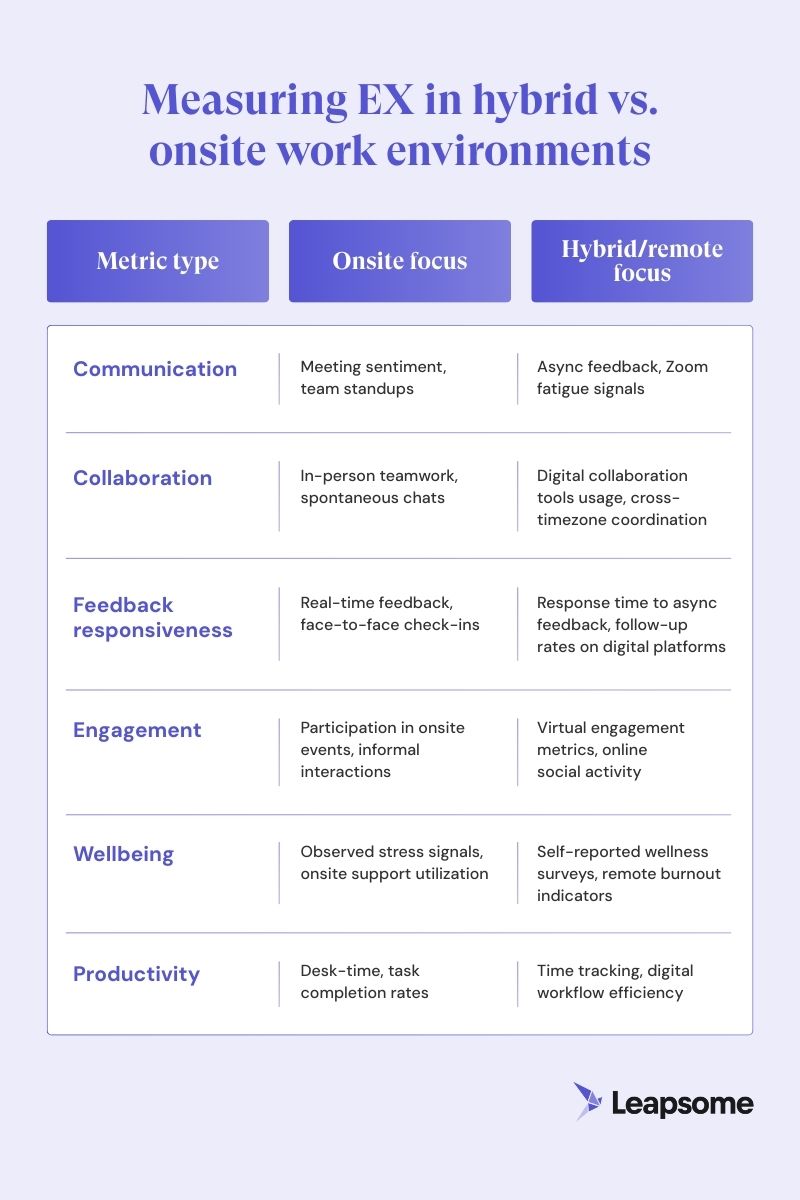
This breakdown shows that employee experience isn’t one-size-fits-all — hybrid and onsite teams have different expectations and engagement levers. By tailoring your measurement approach to match these nuances, you’ll get more accurate insights and create experiences that truly resonate with your workforce, wherever they are.
How EX metrics connect to business KPIs
Employee satisfaction vs. engagement remains a key debate when designing EX metrics, but both perspectives offer useful insights. One shows emotional connection; the other reveals whether employees are thriving in their roles.
Employee experience metrics help orgs understand how employees feel and directly impact key business outcomes like employee retention, productivity, and revenue. Research shows that two-thirds of employees would stay longer if their company provided clear internal career paths, highlighting the importance of tracking internal mobility rates.
Companies that improve their eNPS scores by 10% often see a measurable reduction in voluntary turnover, lowering costly churn and hiring expenses. Similarly, strong internal mobility correlates with higher employee engagement and increased productivity, as workers are more likely to grow within the company rather than leave.
Aligning EX metrics with business KPIs ensures people teams can clearly demonstrate the value of their initiatives. Key performance indicators to track alongside EX include:
- Customer satisfaction scores (CSAT and NPS), which reflect how engaged employees influence customer experiences.
- Revenue per full-time employee (FTE) reveals how workforce effectiveness translates into financial results.
- Time-to-hire is another critical KPI, as a smooth hiring process helps maintain team stability.
- Manager effectiveness scores provide insight into leadership’s role in shaping positive employee experiences.
By connecting EX data with these business metrics, organizations can make smarter, data-driven decisions that benefit both employees and the bottom line.
Don't overlook the UX of your internal tools
The employee experience is shaped by interactions with people. However, it’s also deeply influenced by the systems and tools employees use daily. Friction in internal tools like HRIS, learning management systems (LMS), feedback platforms, and performance management software can become invisible blockers that frustrate employees and hinder productivity. Measuring the user experience (UX) of these tools is critical to identifying and fixing pain points before they escalate.
What to measure
- Tool satisfaction scores (internal CSAT surveys): Gather employee ratings on how satisfied they are with each system to identify overall sentiment.
- Workflow completion rates: Track how efficiently employees complete key processes within the tools to spot bottlenecks or drop-offs.
- Frequency and types of support tickets: Monitor how often and what kinds of issues employees report to understand pain points and system reliability.
- Qualitative feedback from surveys or focus groups: Collect detailed user experiences and suggestions to capture nuances that quantitative data might miss.
Why it matters
Poorly designed or unreliable tools increase cognitive load and waste employee time, directly affecting their overall experience and engagement. Improving tool UX creates smoother workflows, reduces frustration, and empowers employees to focus on meaningful work. Ultimately, enhancing the technology that supports your workforce is a key lever in building a stronger, more seamless employee experience.
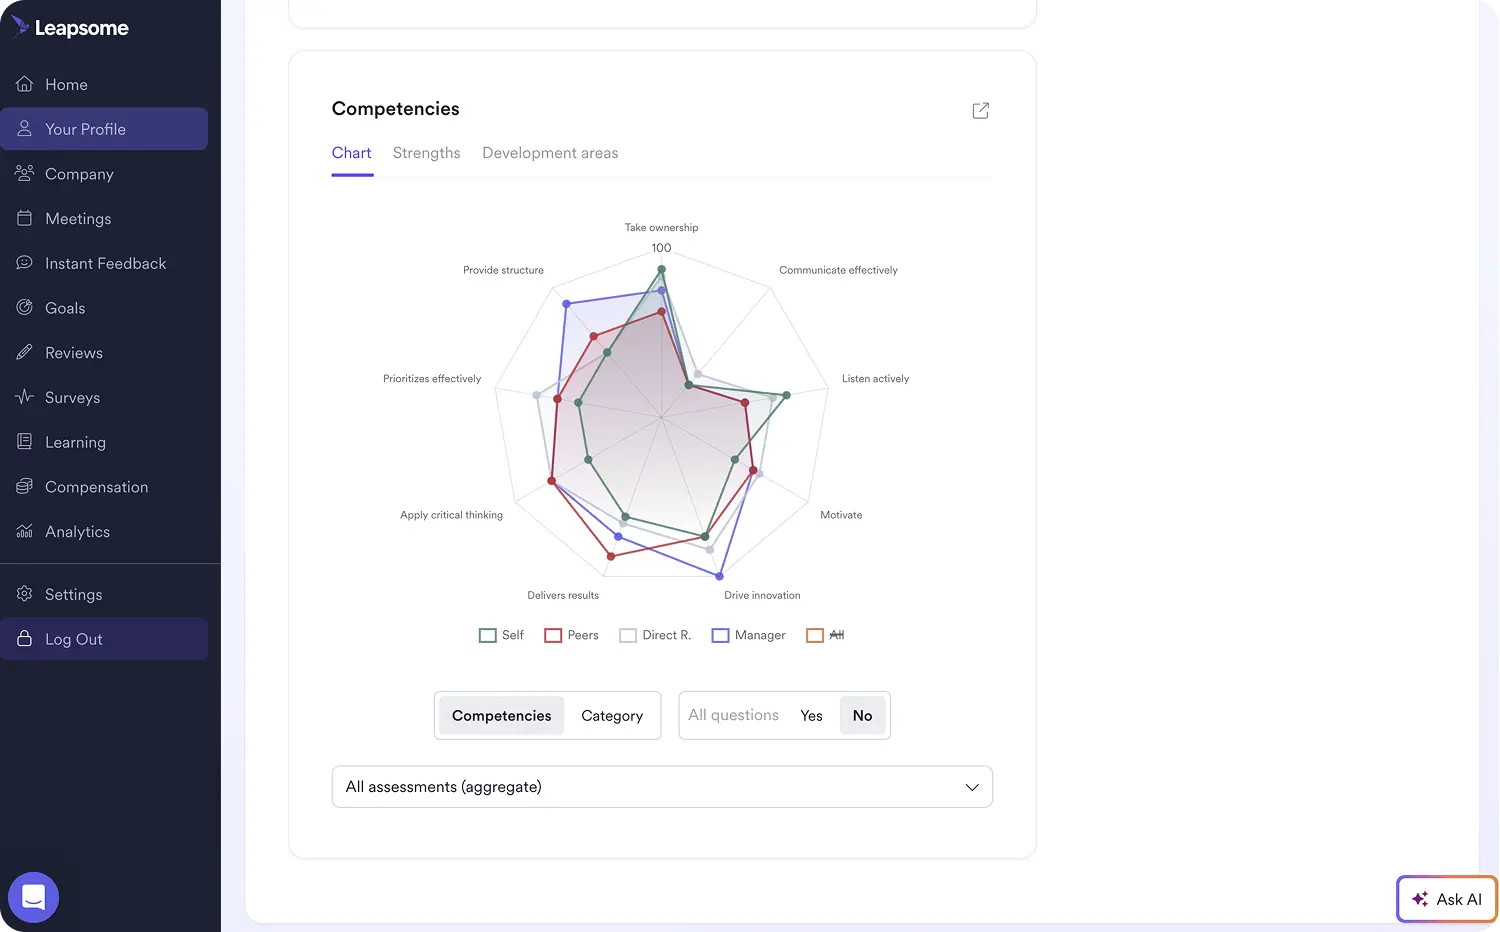
How to build an EX metric dashboard that drives action
Creating an effective EX metric dashboard means combining leading and lagging indicators to get a full picture of employee experience. Leading metrics, like participation rates or manager 1:1 completion, offer early signals, while lagging metrics, such as turnover or eNPS, show results over time.
Dashboards should be updated regularly — monthly or quarterly — to track trends and spot emerging issues quickly. To maximize impact, make the dashboard visible to key stakeholders across HR, Finance, and Executive teams. Cross-functional alignment ensures everyone understands how EX connects to business goals.
Consider using a KPI tree layout that organizes metrics by lifecycle stage or business impact, making it easy to drill down from high-level insights to specific actions. If you're using Leapsome, you can create custom dashboards to visualize data your way. This makes it easier to align efforts and drive data-backed decisions across teams.
Take a strategic approach to measuring EX with Leapsome
Measuring employee experience involves collecting data, yes, but it’s also about understanding the full story behind that data. By focusing on the employee lifecycle, you capture meaningful signals at every stage, from onboarding to exit. Considering work modalities — whether onsite, hybrid, or remote — ensures your metrics reflect the real experiences of all employees, not just one segment. Linking EX metrics to business outcomes like retention, productivity, and revenue helps demonstrate the tangible impact of your people programs. Finally, paying attention to the user experience of your internal tools uncovers hidden friction points that can hinder employee satisfaction and effectiveness.
Together, these dimensions create a comprehensive view that empowers HR and leadership to make smarter, more strategic decisions, moving beyond basic engagement surveys toward a truly data-driven, actionable EX strategy.
With the right approach and tools, teams can evolve their EX measurement to drive real business impact. Leapsome helps companies operationalize this strategic measurement at scale, providing a unified platform to track, analyze, and act on employee experience data across the full lifecycle.
🧨 Transform your employee experience measurement
Track the right metrics across every stage of the employee lifecycle with Leapsome
👉 Book a demo
Vanda Williams

.jpg)


.jpg)
.png)
Ready to transform
your People operations?
Automate, connect, and simplify all HR processes across the employee lifecycle.
.webp)
.webp)
 Request a demo today