
How to calculate and sustainably grow revenue per employee

.png)
Revenue per employee is a widely used business metric — and for good reason. It’s simple to calculate, track over time, and compare to internal and industry benchmarks to gauge organizational efficiency.
Where many companies fail is in treating revenue per employee as a financial metric exclusively. This angle reveals little because it doesn’t account for the people decisions behind the numbers, like hiring and management strategy. Case in point: Companies that prioritize trust, agility, and effort generate 8.5 times more revenue per employee than the U.S. public market average.*
If you feel this metric isn’t where it should be, you likely don’t need fewer people to work harder. It isn’t a headcount problem. It’s a culture problem.
This guide covers how revenue per employee works and how to calculate it for your organization. You’ll also learn what influences this metric and how to improve it sustainably through positive work conditions.
“People first doesn’t mean business last. When you give employees space to think and do, you unlock performance, loyalty, and innovation. People strategy is business strategy.”
— Luck Dookchitra, VP People & Culture, Leapsome
* Great Place To Work, 2025
How revenue per employee works and how to calculate it
Revenue per employee, also called revenue per headcount, is a workforce efficiency metric. It measures the average amount of revenue each full-time employee generates. In mathematical terms, it’s the ratio between a company’s total revenue and total headcount. Revenue per employee is an aggregate metric, so it displays organization-wide efficiency, not individual or departmental output.
Organizations with a significant mix of full-time and part-time workers often use full-time equivalent (FTE) instead of headcount. FTE converts the hours of part-time or temporary workers into the hours of a standard full-time employee.
Keep in mind that revenue per employee is distinct from the similar metric profit per employee. This number accounts for expenses to show final earnings rather than gross output.
How do you calculate revenue per employee?
The formula for calculating revenue per employee (or revenue per FTE) is simple enough:
Revenue per employee = Total revenue ÷ Average number of employees or FTE
Using that formula, here’s how to calculate revenue per employee in three steps:
- Round up the data: Get a copy of your income statement for the period you’re analyzing, and locate total revenue.
- Decide who to include: Review your workforce’s makeup, and decide whether to use headcount or FTE. Some organizations leave out contractors unless their output makes up a significant amount of total revenue.
- Run the numbers, and put them in context: Divide revenue by the average number of employees for the period to arrive at your revenue per employee figure. To keep it from becoming just another checkbox on an HR report, interpret the metric as part of a broader story. Compare the result against your organization’s historical trend data to see how efficiency is evolving over time. Then, benchmark the number against similar companies in your industry to see how yours stacks up.
Behind the numbers: What influences revenue per employee?
Interpreting revenue per employee in isolation can be misleading. A lot of elements go into this metric, and you won’t get the full meaning of the number without considering all of them. Here are some of the most impactful.
Business context
Your industry sets the baseline, in part because different sectors have different labor requirements. Some need a large workforce to generate revenue, while others can get by with a small team. January 2026 data compiled by NYU Stern Professor of Finance Aswath Damodaran showed that the spread in revenue per employee between industries is enormous, ranging from barely $1,000 in general retail all the way up to more than $1.7 million in entertainment software.
Business models also contribute. Capital-intensive business models, like manufacturing, require expensive physical assets and large workforces. This causes them to have lower revenue per employee than sectors like software, where a small workforce can support a large customer base.
Workforce strategy
A workforce with a higher percentage of directly revenue-generating roles will have higher revenue per employee. For instance, a business that has more salespeople than lawyers and IT admins will generate more revenue.
An organization’s growth stage and hiring strategy also determine what a realistic number looks like. For example, a startup that brings on new hires ahead of revenue temporarily lowers the ratio as earnings catches up.
“Seventy-five percent of the company spend is on salaries. If that’s not effectively spent, you’re throwing money away. HR exists to make sure it’s invested wisely.”
— Melanie Naranjo, Chief People Officer at Ethena
Operational efficiency
How well employees convert their time and skills into value is at least as important as how many people are on the payroll. Recent Gartner research highlighted employee efficiency and value creation drive better business outcomes. Producing high-quality work within deadlines leads to positive effects like higher revenue and a stronger brand reputation.
Sustainable improvement through strengthening your people systems is usually a better bet than short-term cost-cutting, which is often only a temporary win. To drive improvements in your underlying strategy, you’ll need to understand your situation first. That starts with reliable workforce data. Leapsome can help.
“The purpose of an HR function is to create a people strategy that most effectively drives business goals. It starts with the business, then you build your people strategy from there.”
— Melanie Naranjo, Chief People Officer at Ethena
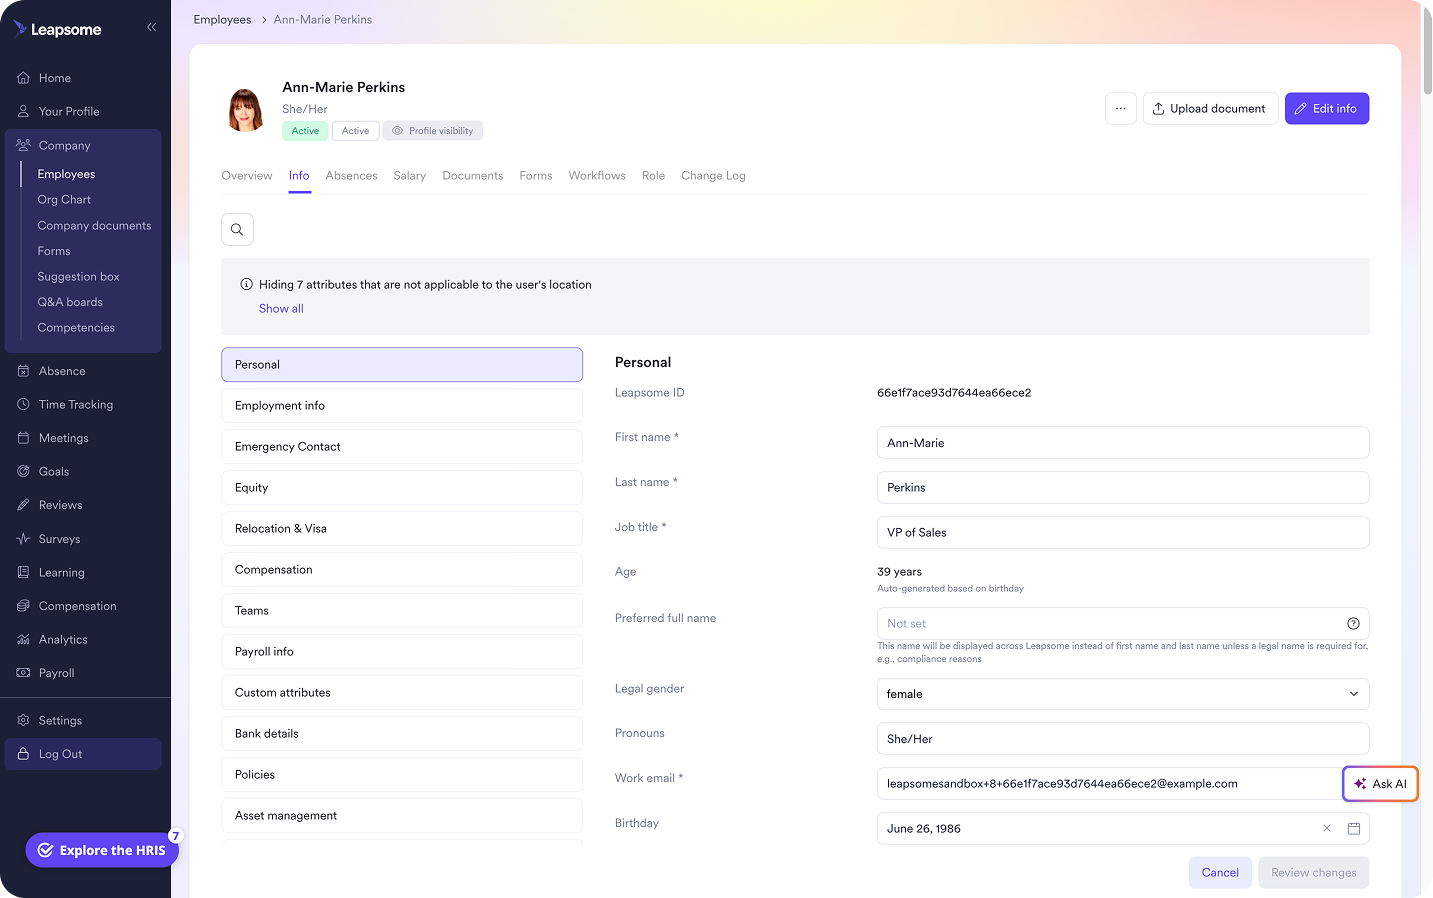
📁 Workforce data that never goes stale
Keep employee data connected in one centralized location, monitor workforce growth, and pull exact headcount numbers whenever you need them.
👉 Explore Employee Records
How people factors impact revenue per employee
“HR shouldn’t just support business decisions — you’re shaping them. You have to think like a profit center, not an administrative silo.”
— Anita Anthonj, Founder & CEO, Talaera
High revenue per employee doesn’t necessarily signal a healthy or productive workforce. While it could reflect stellar management and engaged employees, it can just as easily be the result of understaffing or high turnover.
The most effective HR leaders interpret revenue per employee through a holistic lens, weighing it against the metrics that capture the “why.” This includes:
- Employee engagement.
- Performance.
- Retention.
- Manager effectiveness.
- Learning and development progress.
- Absenteeism.
An analysis by McKinsey concluded that low productivity among individual employees stems from three main sources: lacking role-specific skills, being disengaged from the work, and working on low-value tasks that don’t make the most of employee time. McKinsey calls these the skill gap, the will gap, and the time gap, respectively. Each one maps cleanly to the metrics above:
- Skill gaps turn up in performance data, and HR teams close them through targeted learning and development.
- Will gaps show up in declining engagement, rising absenteeism, and high turnover.
- Time gaps surface in output and performance, as well as in low manager effectiveness when OKRs and KPIs are unclear.
As these metrics improve and gaps narrow, revenue per employee can improve with them. Investing in employee enablement helps your existing workforce do more with what it already has, so you don’t need to increase headcount or workloads. This leads to healthy, sustainable revenue growth.
But closing these gaps takes more than good intentions. To improve your numbers, you need clear visibility into what performance looks like now. Leapsome builds that visibility into managers’ everyday workflows.
“The most important metric is performance of the company. Everything else — engagement, sentiment — should serve that.”
— Luck Dookchitra, VP, People & Culture, Leapsome
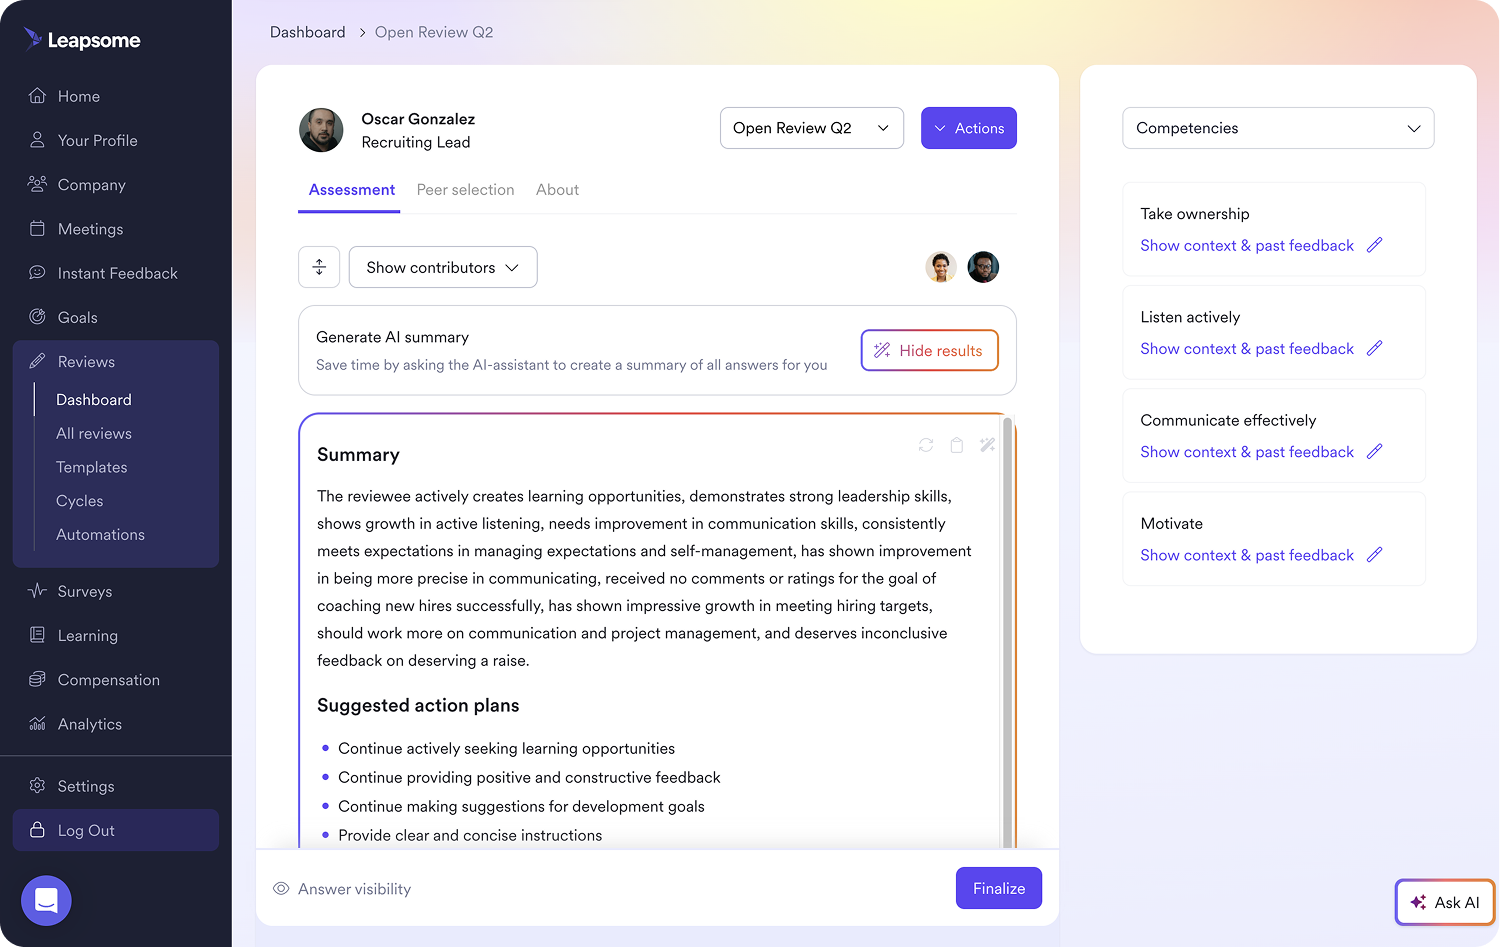
💪 Convert performance insights into measurable outcomes
Equip managers with the tools they need to hunt down skill gaps and keep them closed with continuous feedback loops.
👉 Explore Performance Reviews
Convert data into revenue per employee growth with Leapsome
HR leaders are expected to demonstrate business impact with hard data, but most financial metrics can’t explain workforce performance trends on their own. Without workforce analytics connecting the dots between people, performance, and financial outcomes, HR teams spend more time reporting raw numbers than revisiting the decisions that make those numbers tick. The right software can close that gap.
Leapsome is an AI-powered people platform that helps teams discover and act on what’s really driving financial metrics. By connecting everything HR leaders need to see the full picture, teams can:
- Ground reporting in reliable workforce data: Great reports start with data that’s clean and current. Leapsome’s Employee Records instantly update details like role changes, job history, and reporting lines across the system.
- Root out skill gaps dragging down performance: Structured, AI-powered Performance Reviews and 1:1 meetings show skill gaps by bringing in insights from past performance and peer feedback.
- Turn skill gaps into growth: Trackable Goals & OKRs and targeted Learning paths tackle skill gaps. Write your own or choose one from Leapsome’s expert-curated learning content library.
- Catch burnout early: Engagement Surveys track sentiment over time, letting you step in before dips turn into lower productivity or higher turnover.
“Leapsome is our go-to place for looking at our work from a goal perspective — how we’re progressing and hitting those goals. It has proven to be really successful in uniting us, while working remotely and across different offices, and keeping us focused on the right things. Leapsome is a core part of how we do our business.” — Lisa Potter, VP of Marketing | KCare
💪 Make your workforce data work together
Connect workforce insights to performance data and engagement signals for a well-rounded view into what’s behind the numbers.
👉 Request a demo
FAQ
What’s the average revenue per employee?
As of January 2026, the average revenue per employee in the U.S. is just over $111,000. Industry benchmarks vary widely, however, from around $1,000 up to more than $1.7 million.
What’s a good revenue per employee?
What counts as a good revenue per employee depends largely on your industry, business model, and operational efficiency. It’s best to interpret revenue per employee alongside other HR analytics, such as engagement and performance data, to understand the entire equation.



.jpg)


%2520(1).png)